Lorenz Attractor Weaves
2025
Overview
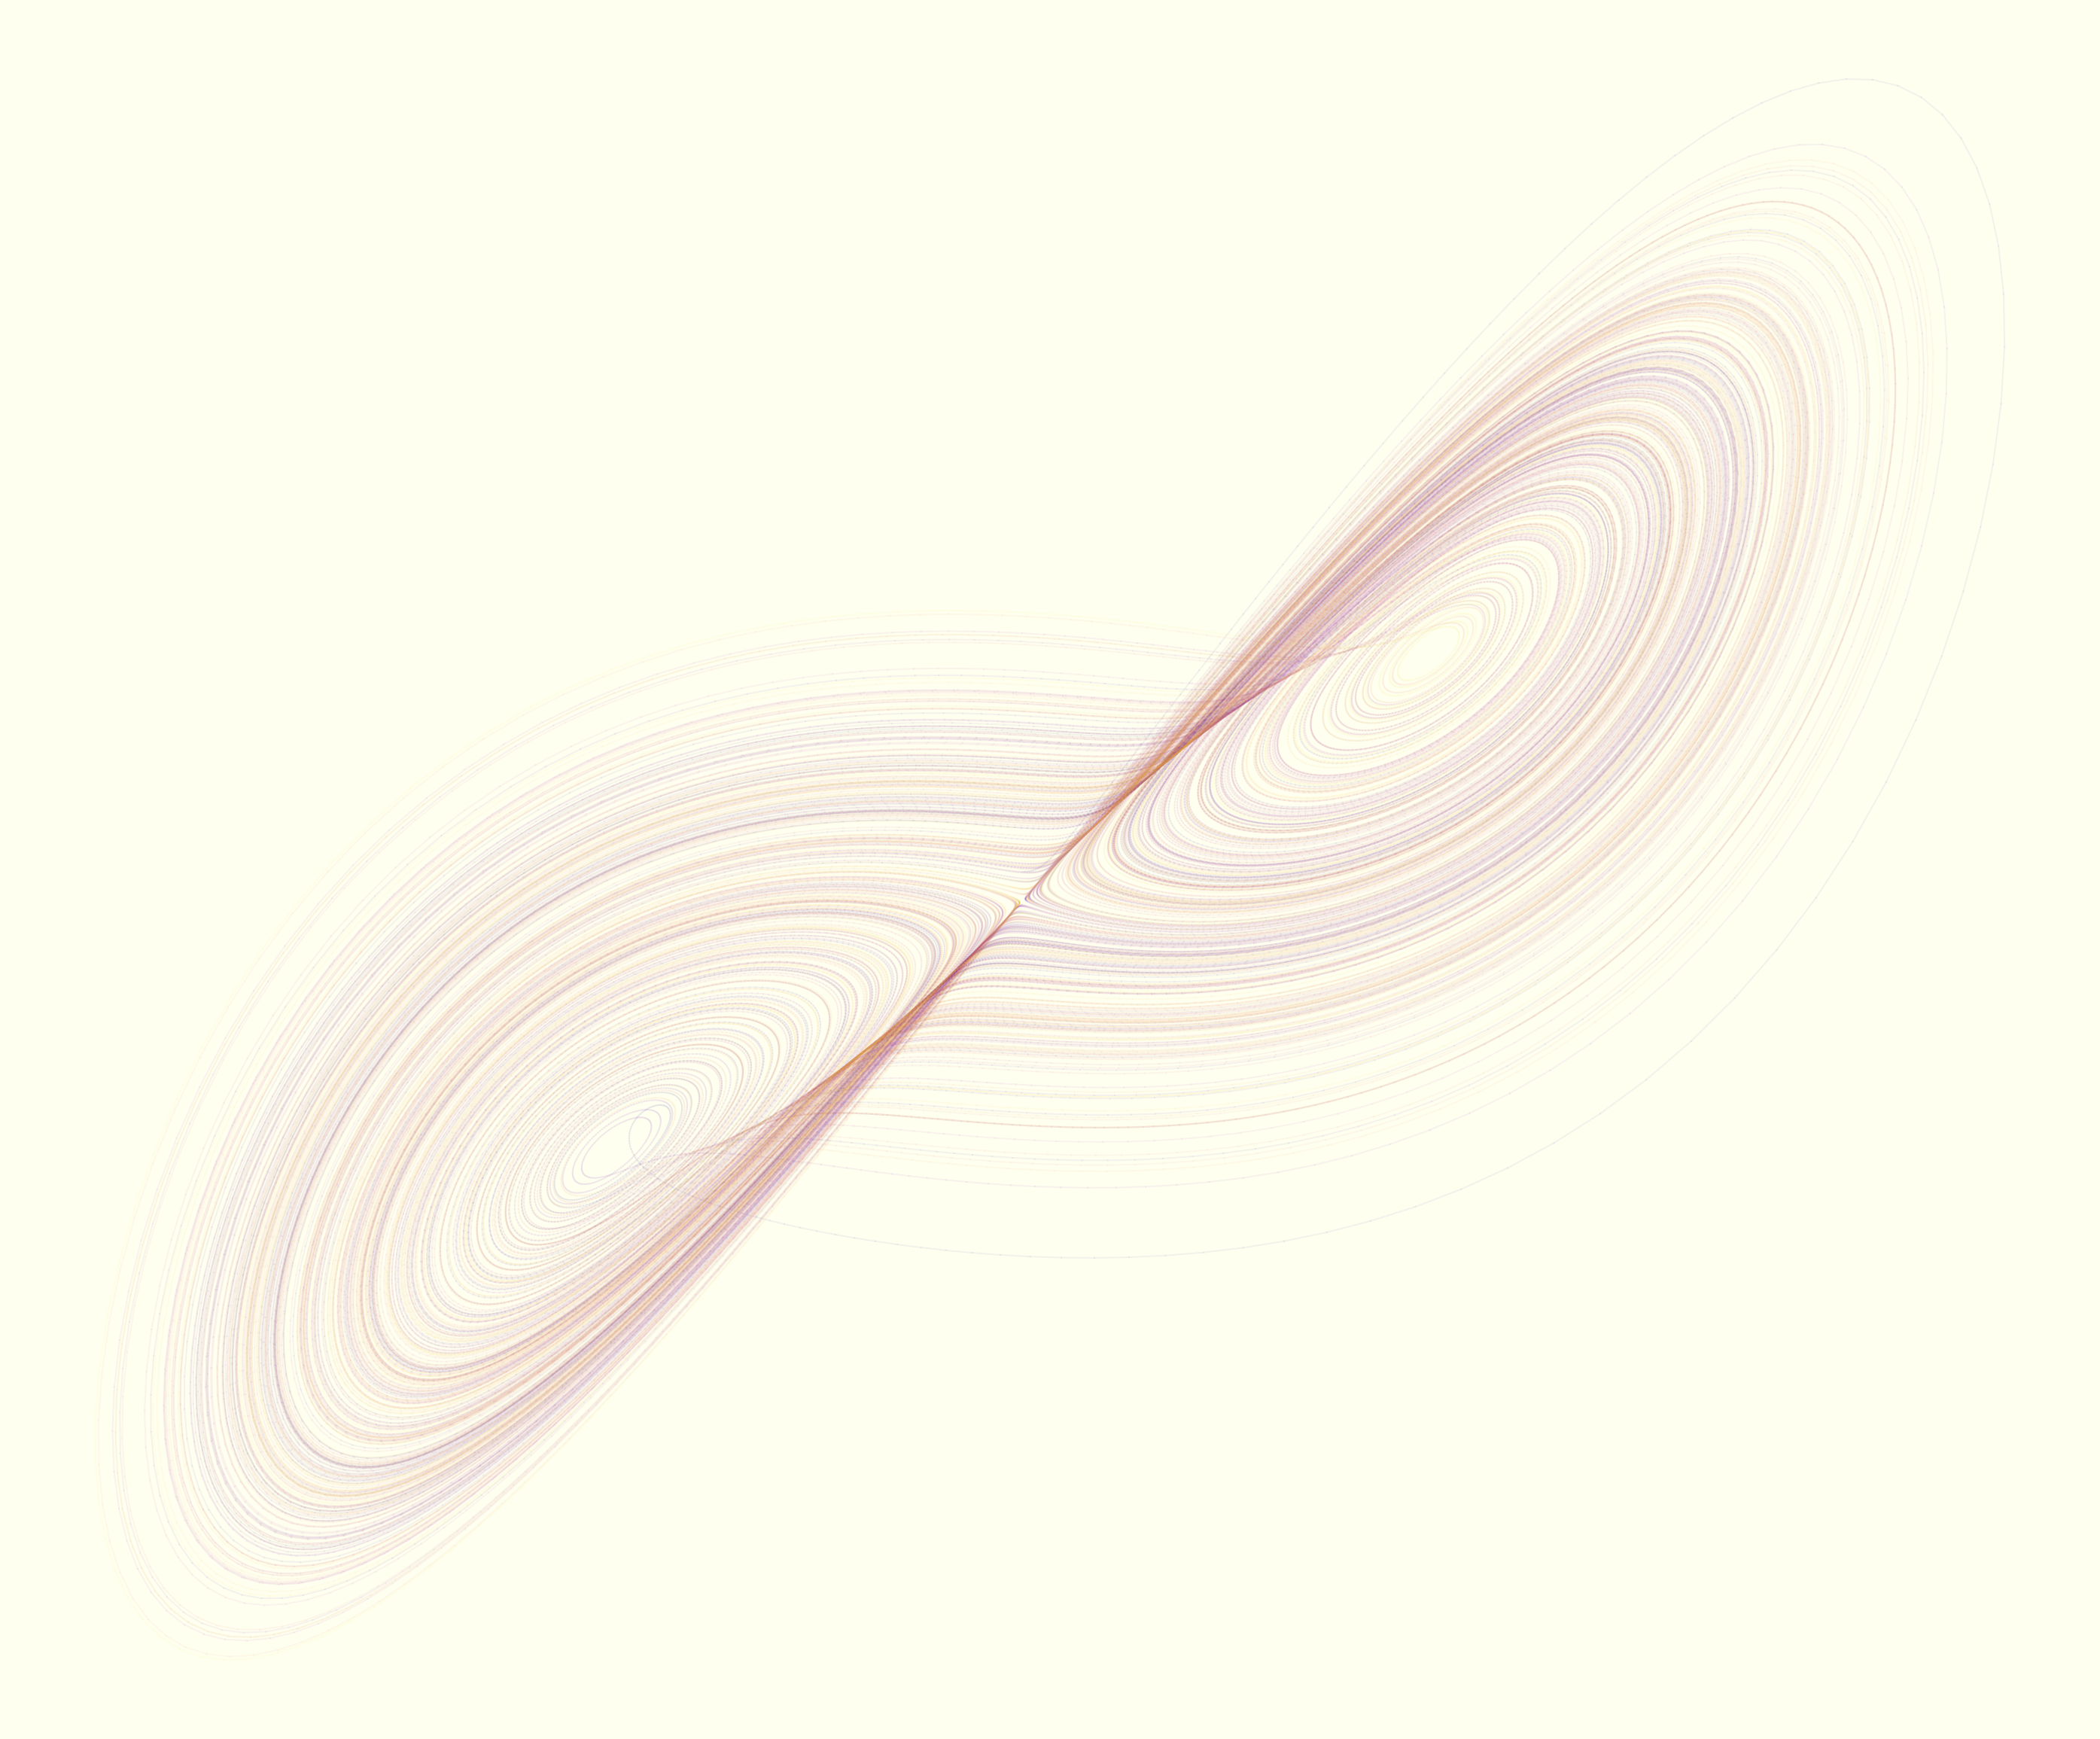
This figure shows the Lorenz attractor, a famous model of chaos built from three coupled differential equations. The system is defined by dx/dt = σ(y − x), dy/dt = x(ρ − z) − y, and dz/dt = xy − βz. I used σ = 10, ρ = 28, and β = 8/3, which are the original values Edward Lorenz studied in 1963. Starting from x = 0, y = 1, and z = 1.05, I ran 100,000 steps with a timestep of 0.005, updating x, y, and z at each iteration using Euler’s method.
Each new position was calculated by taking the current values and adding the rate of change times the timestep. These rates are nonlinear, involving terms like x*y and x(ρ − z), which causes the path to fold and stretch unpredictably. I plotted the (x, y) pairs over time with colors taken from a plasma colormap. I used low opacity and fine linewidths to let thousands of overlapping loops form a layered texture. Even though the motion is governed by strict rules, the result never exactly repeats, giving the attractor its woven appearance.