Mandelbrot Set
2025

Overview
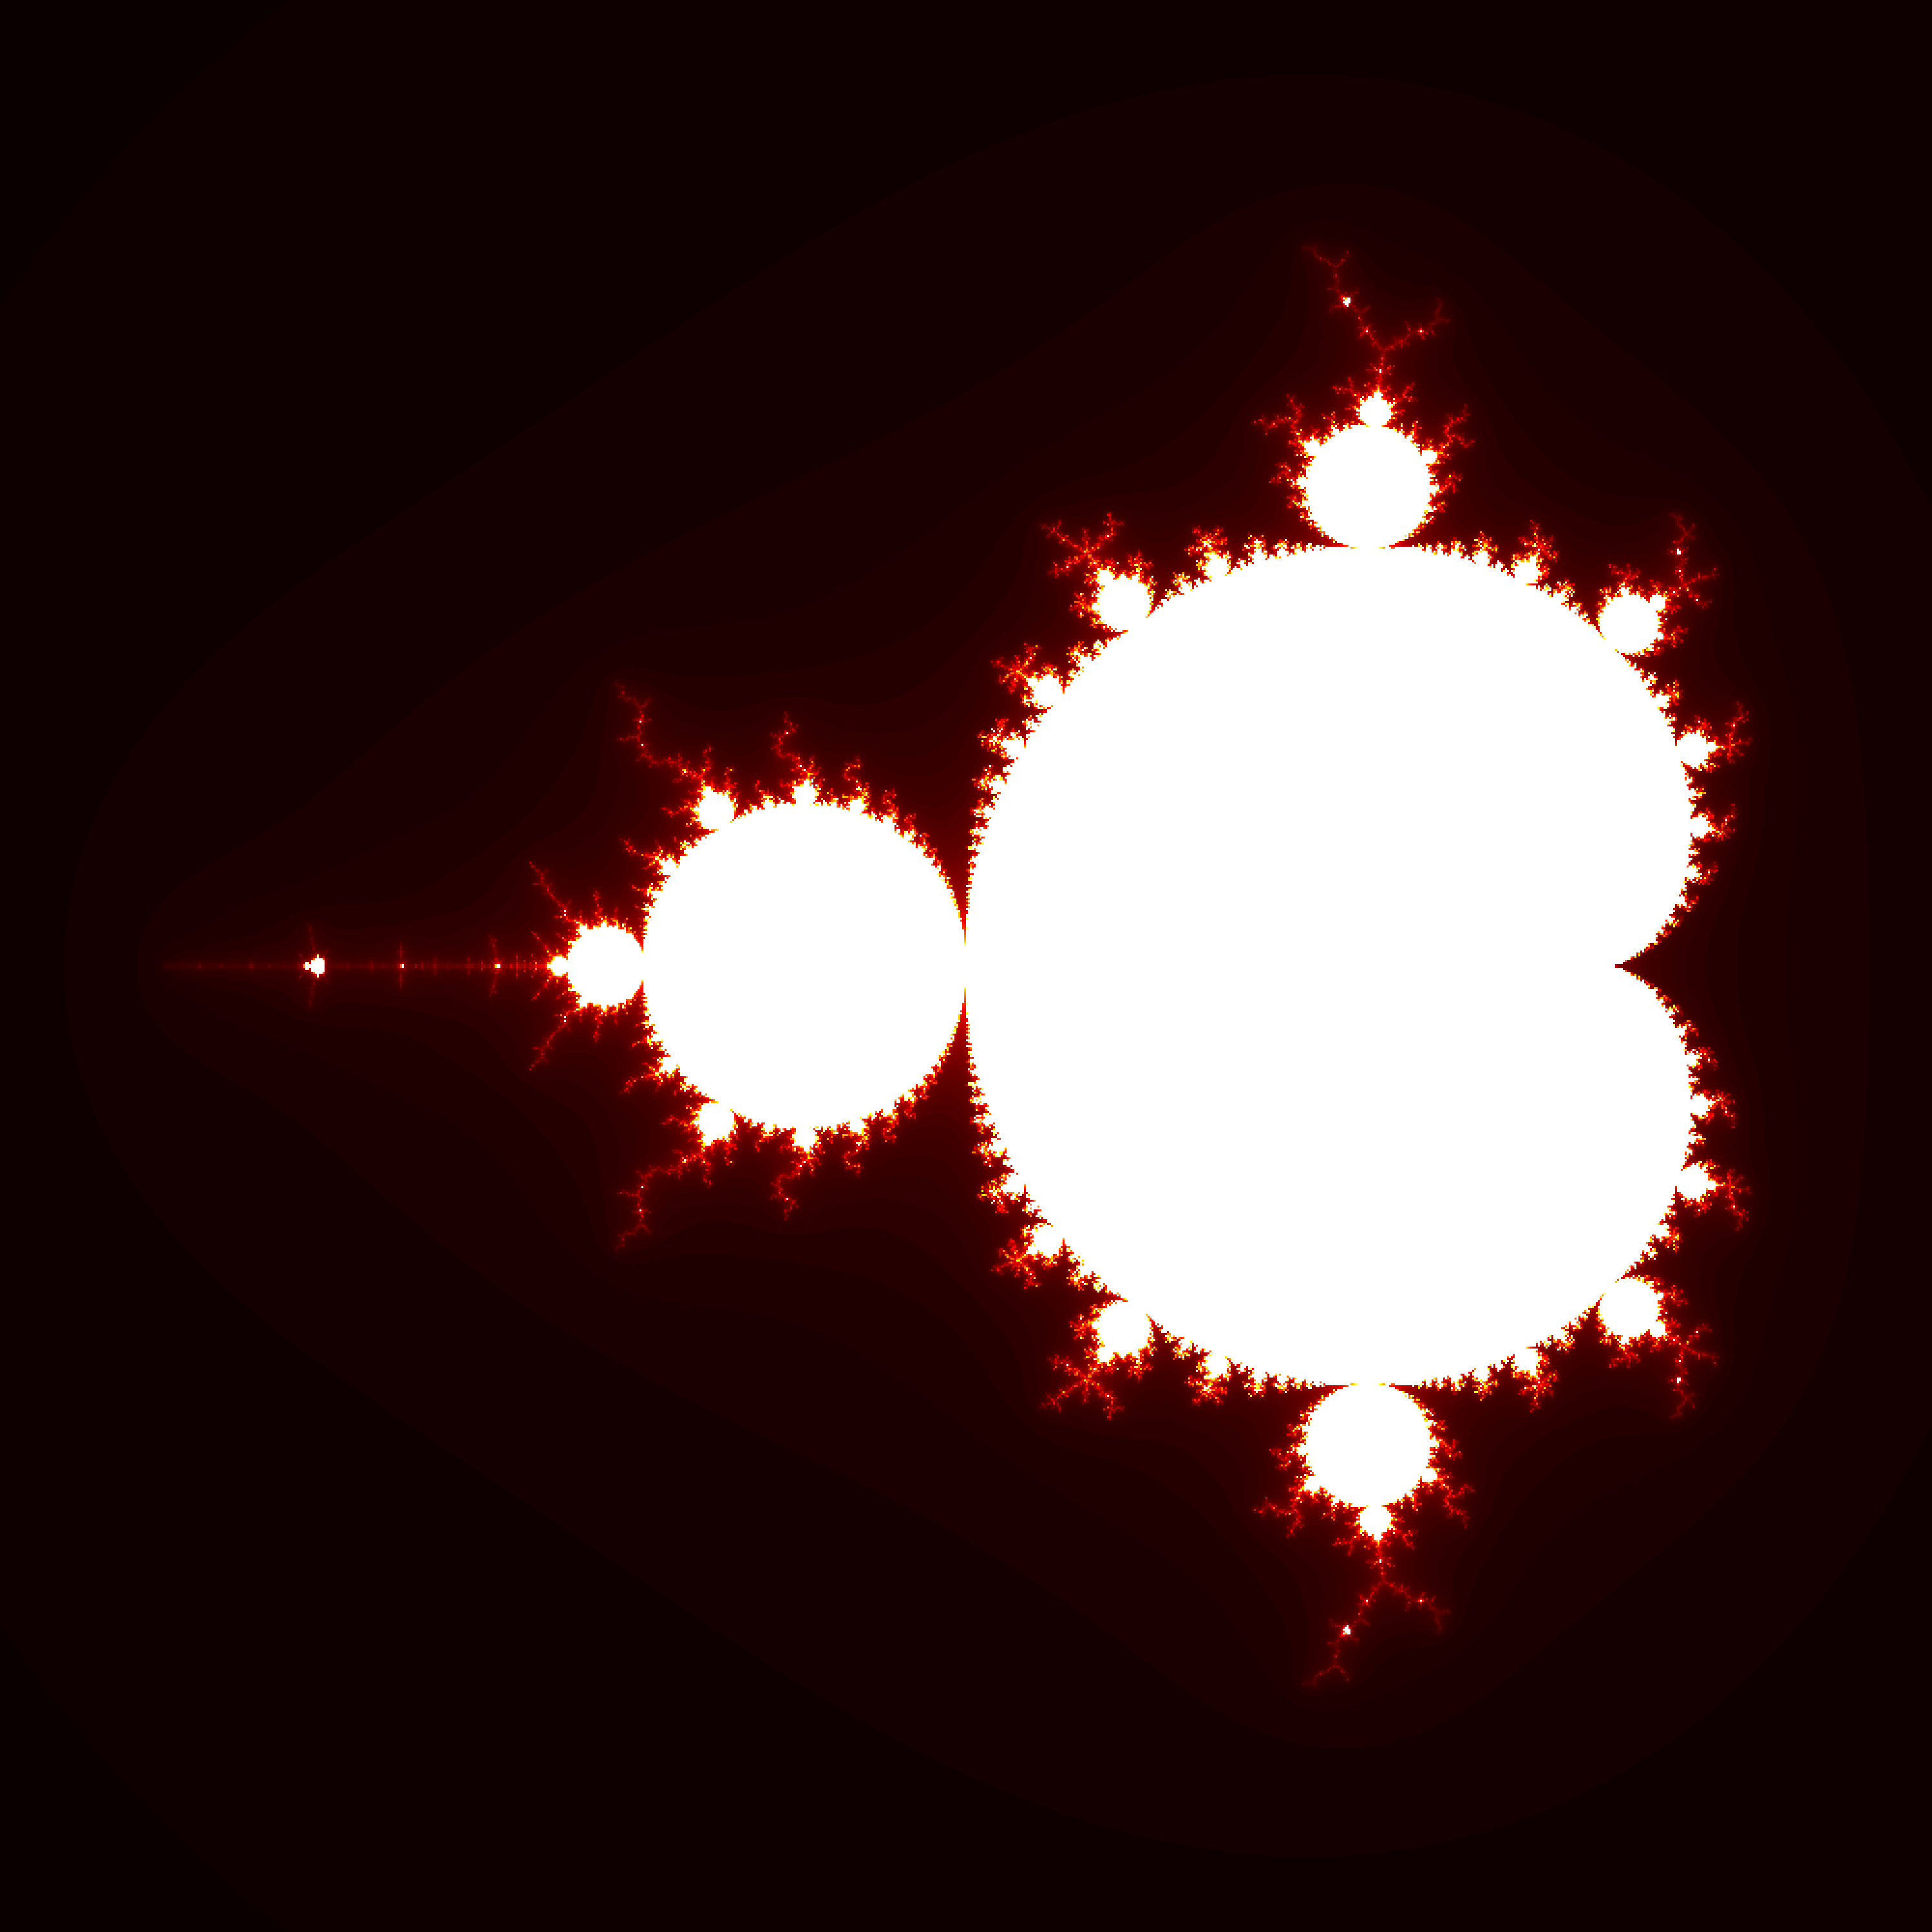
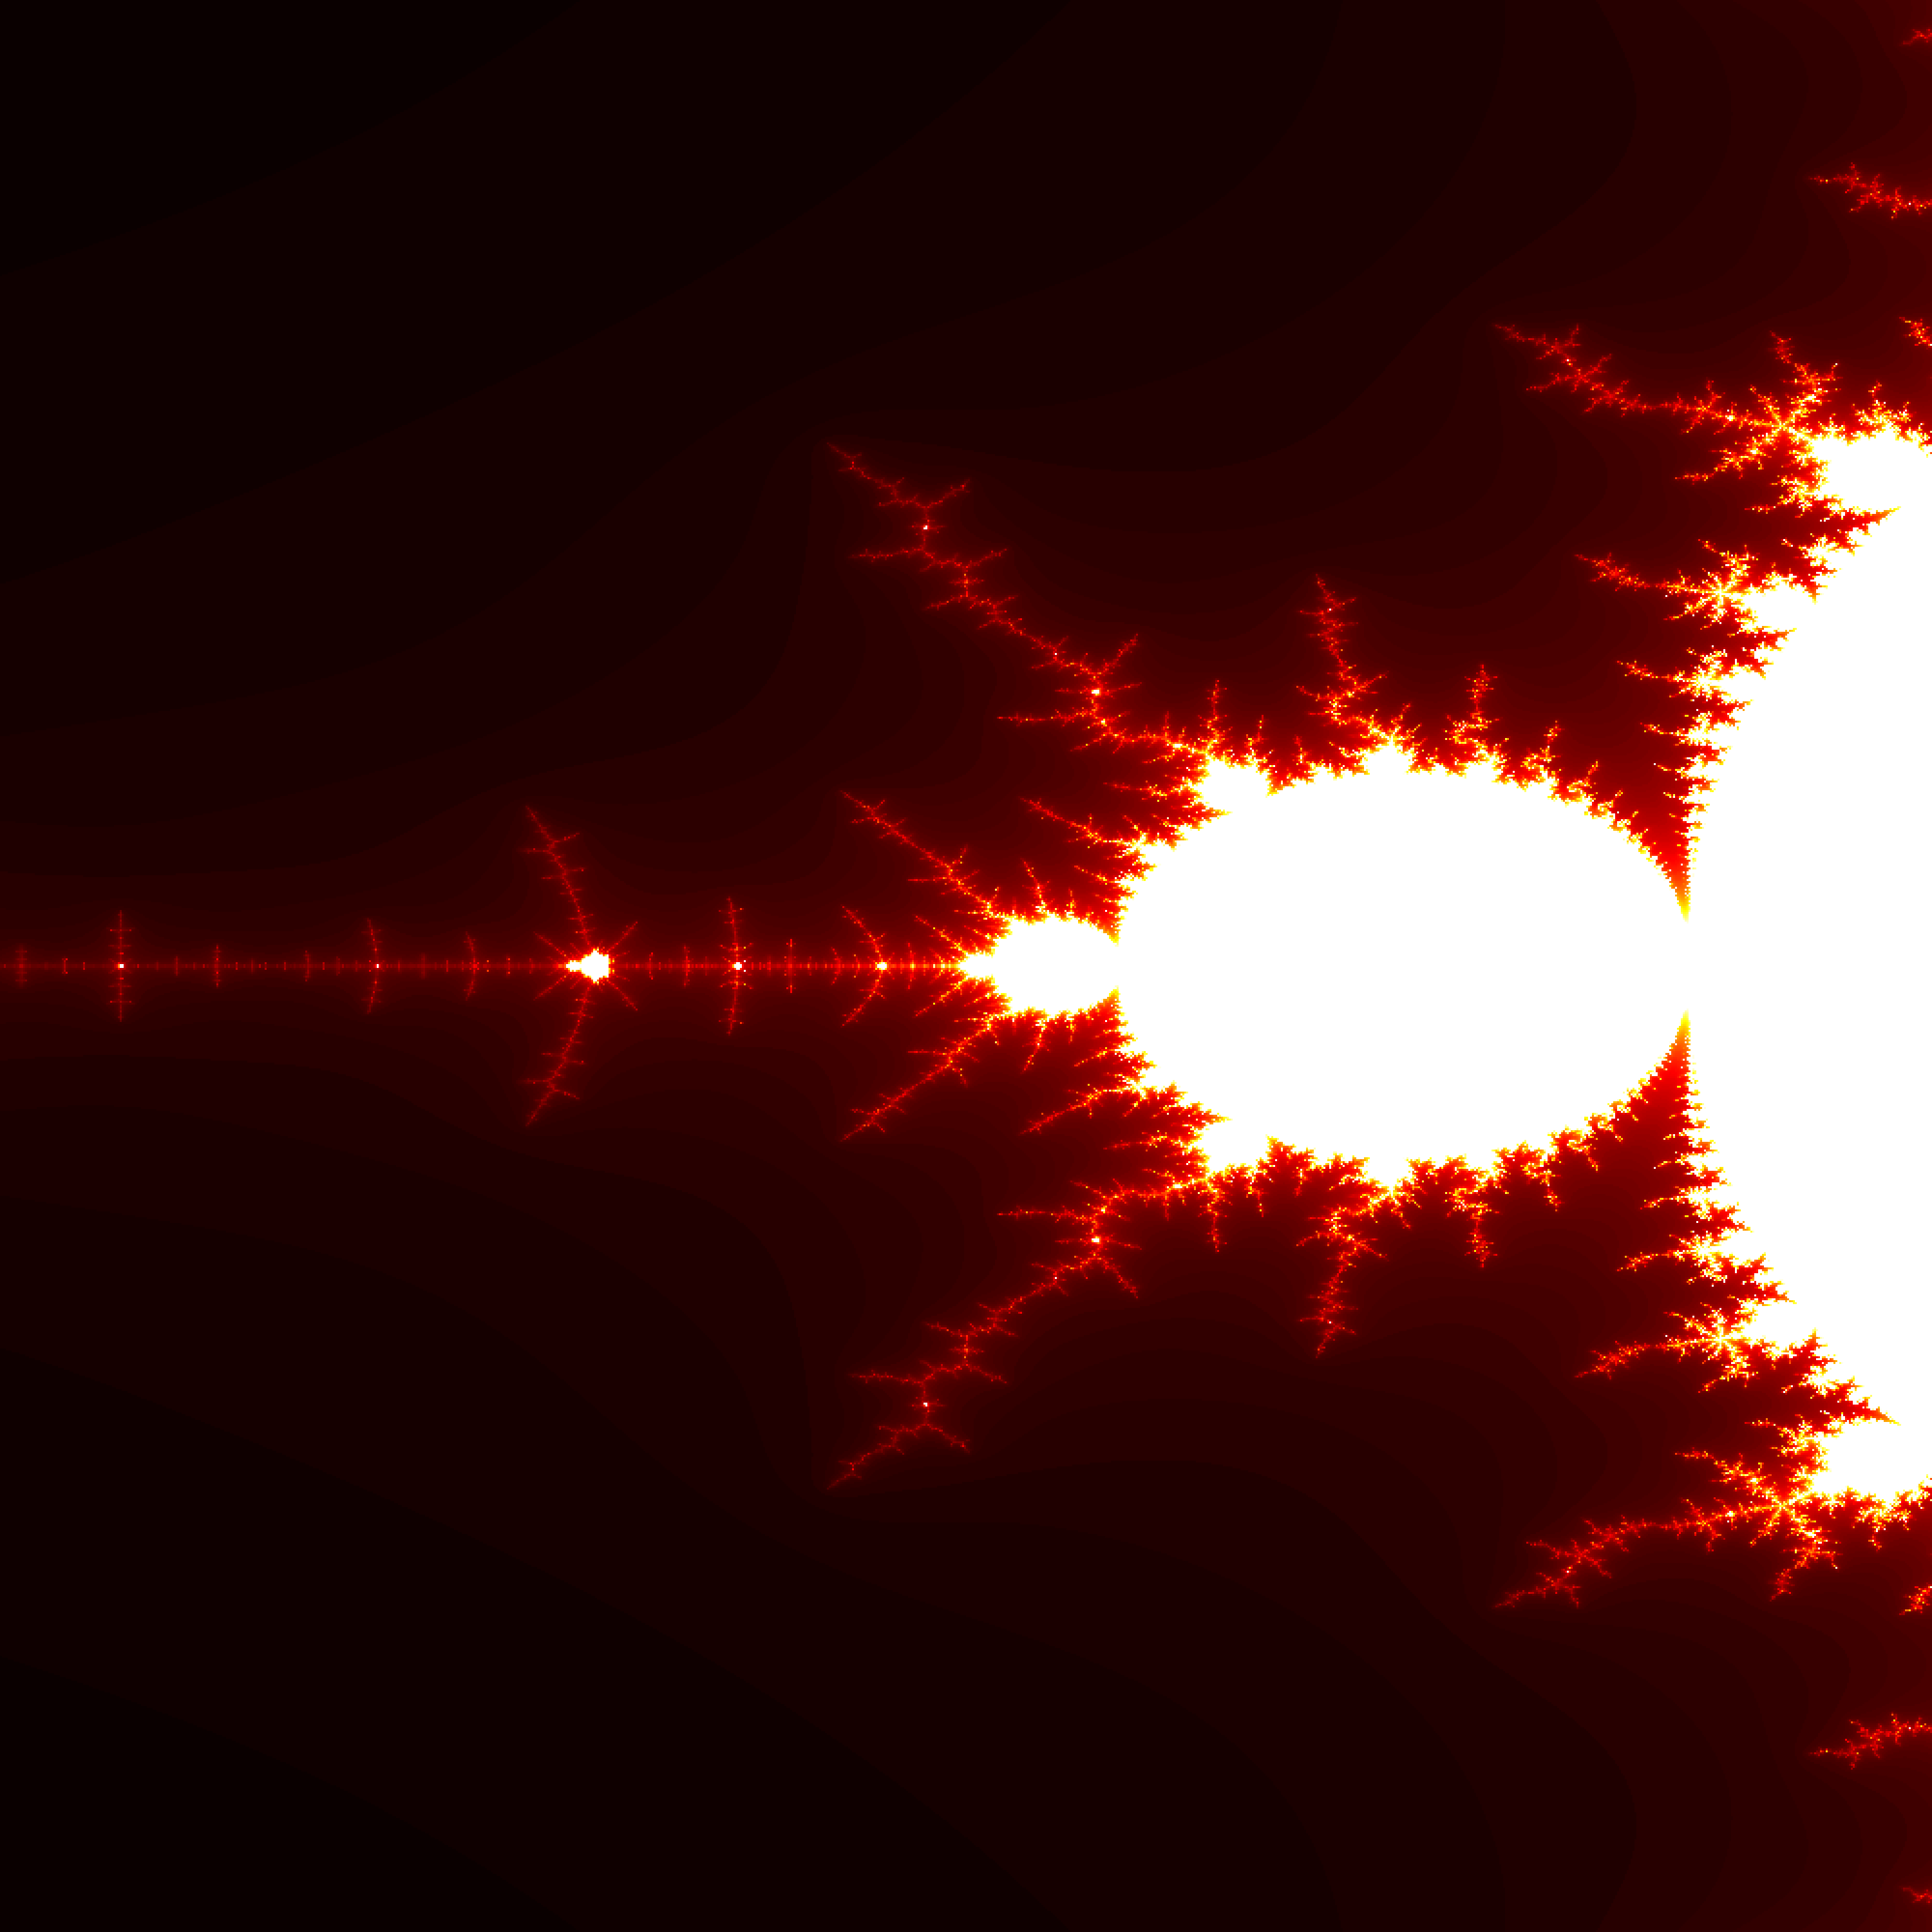
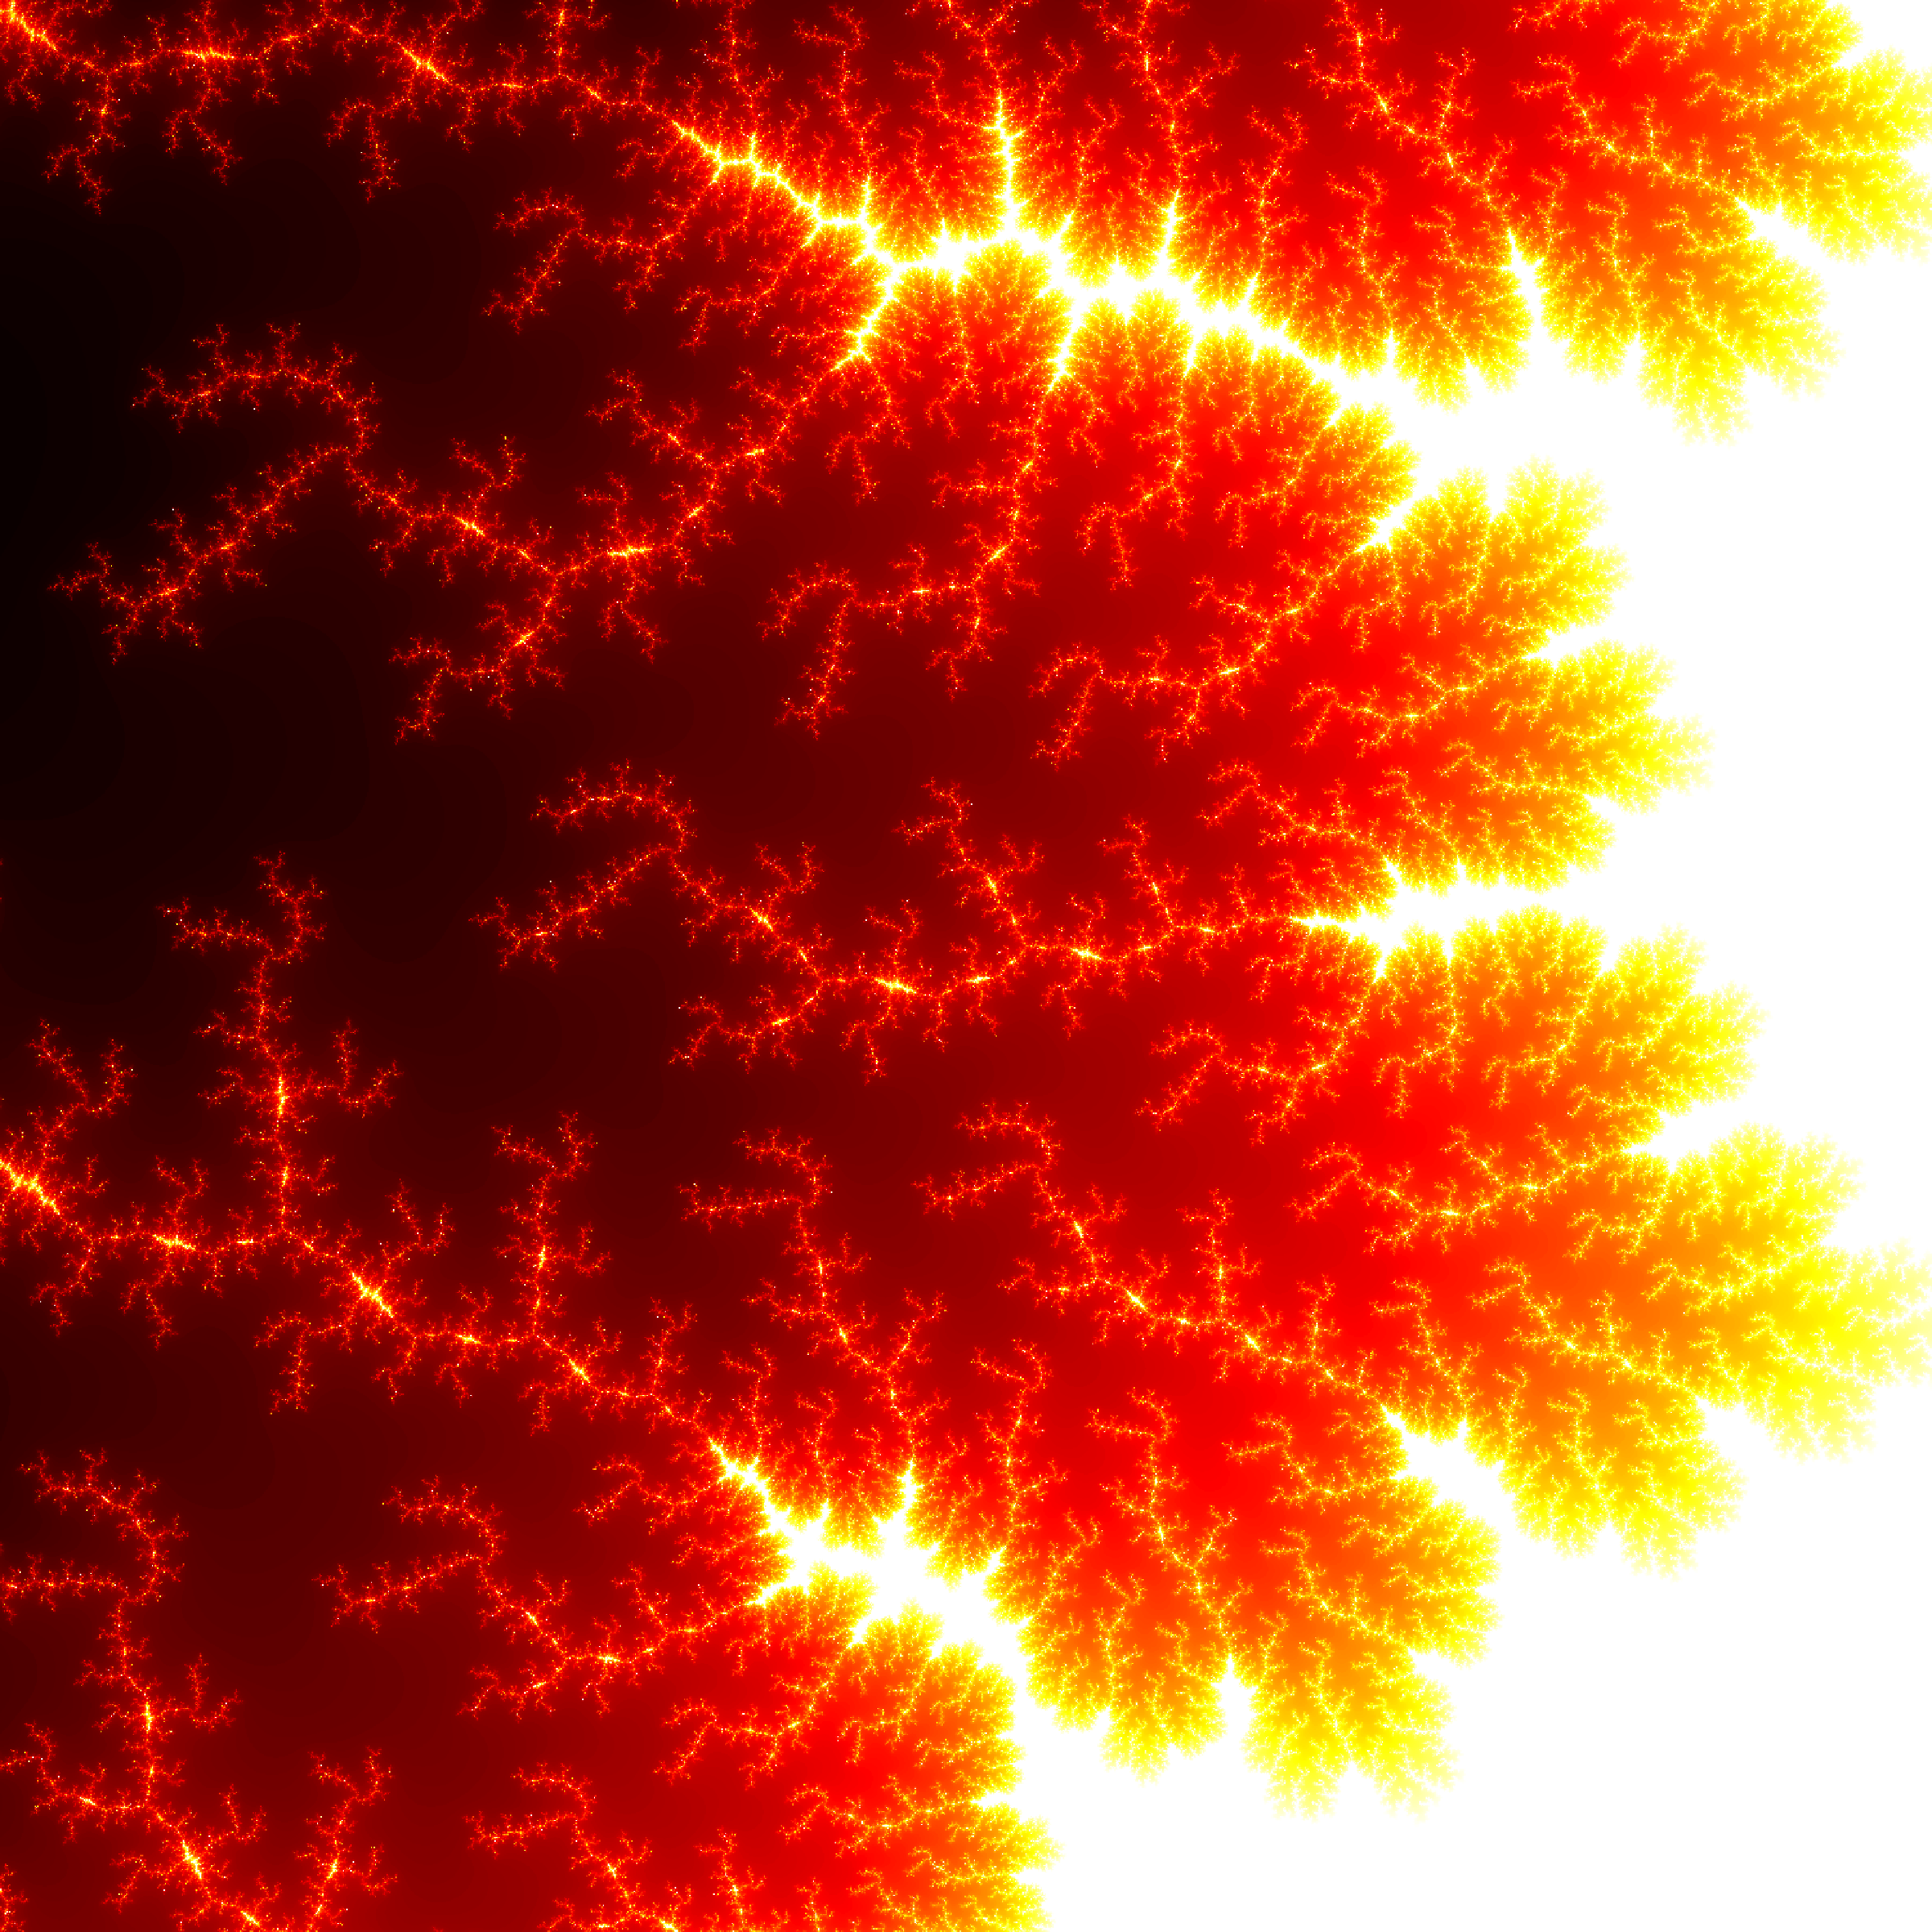
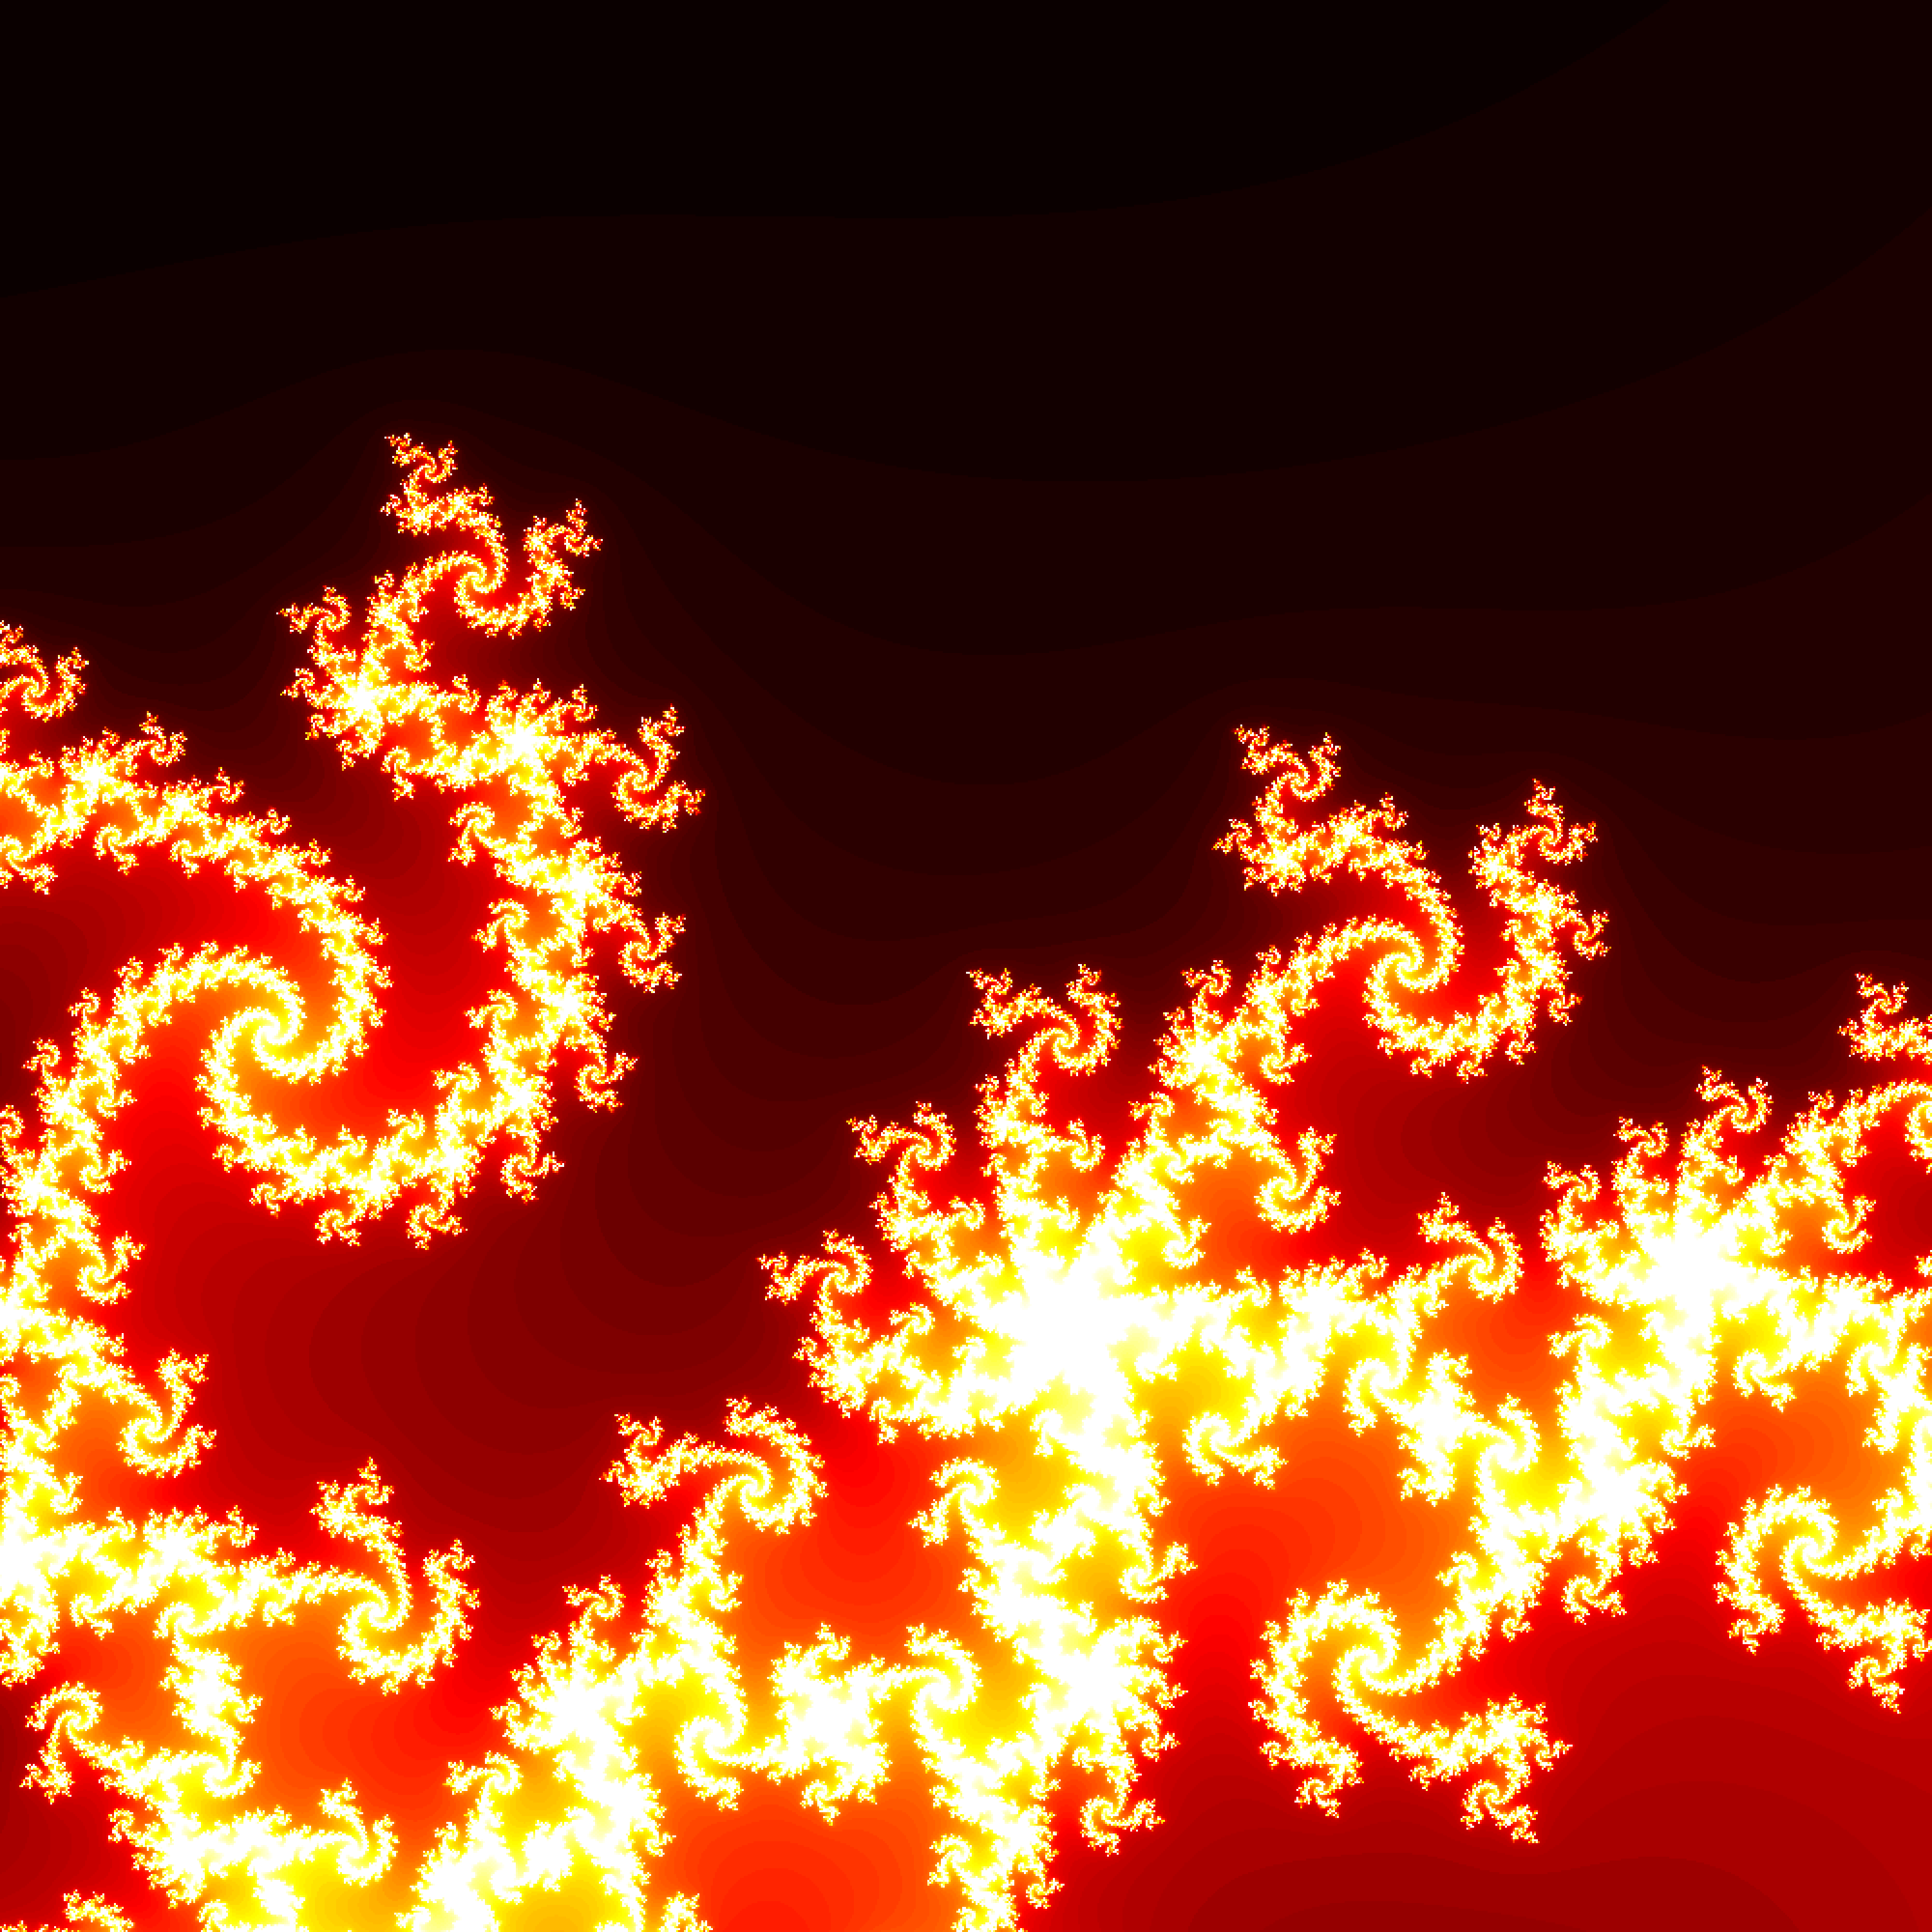
The Mandelbrot set is one of the most iconic and profound objects in mathematics. It is defined as the set of complex numbers c for which the recursive sequence zn+1 = zn² + c, starting at z₀ = 0, remains bounded. What appears simple in form reveals an infinitely detailed and self-referential structure upon closer inspection. The boundary of the set is where its complexity lies. It is nowhere smooth and everywhere unstable. At every zoom level, the Mandelbrot set presents miniature copies of itself, surrounded by fractal filigree that continues forever. It is not just a mathematical curiosity but a deep visual manifestation of iteration, recursion, and complex dynamics.
At its core, the Mandelbrot set is a map of stability. Points inside the set represent complex values for which the iteration remains confined, never diverging. Points outside represent escape — trajectories that grow unbounded with time. This binary classification becomes a canvas for continuous variation when colored by the number of iterations before divergence. What emerges is not just a shape but a computational portrait of mathematical infinity. The set encodes an intricate history of dynamical systems and bifurcations, serving as a catalog of Julia sets. It is one of the few mathematical objects that is simultaneously exact, infinitely complex, and entirely visual.
To render the Mandelbrot set, I implemented a pixel-by-pixel scan across a rectangular region of the complex plane. Each pixel was assigned a complex coordinate and iterated under the recurrence relation zn+1 = zn² + c. For each coordinate, I tested whether the sequence escaped beyond a magnitude threshold and recorded the number of iterations taken to do so. This count was used to determine the pixel’s color, providing a continuous spectrum that reflects the escape rate. I chose a maximum iteration cap to balance computational load with visual depth, ensuring fine detail at zoomed levels without overwhelming memory.
I optimized the computation by minimizing redundancy and avoiding unnecessary arithmetic. To improve image quality and contrast, I mapped the iteration count to a custom color gradient, using exponential scaling to enhance the edge details. I then created high-resolution renderings of zoomed-in regions by adjusting the real and imaginary axis ranges while keeping the resolution fixed. This allowed me to explore the recursive structure of the boundary with precision. The resulting images show the Mandelbrot set not as a static form, but as an unfolding of complexity, controlled entirely by pure iteration over the complex numbers. Each frame I generated is a window into the edge of mathematical chaos, shaped by nothing but the repeated squaring and addition of complex values.
You can find my code repository here.